Accessing crustal velocity databases
Crust 2.0 Database
The CRUST 2.0 3 is a global 2x2 degree velocity model of the earth’s crust. Each individual profile is a 7 layer 1D-model.
Citation
- 3
Bassin, C., Laske, G. and Masters, G., The Current Limits of Resolution for Surface Wave Tomography in North America, EOS Trans AGU, 81, F897, 2000.
Accessing the Crust 2x2 database
Here we utilize the pyrocko.dataset.crust2x2 module to query the Crust 2.0 database
>>> from pyrocko import crust2x2
>>> profile = crust2x2.get_profile(23., 59.)
>>> print profile

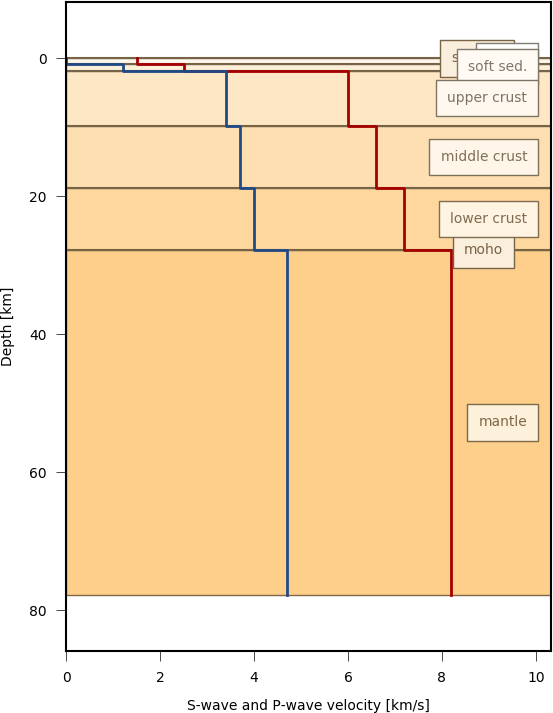
type, name:              T9, thin Margin /shield  transition, 1 km seds.
elevation:                          -764
crustal thickness:                 26000
average vp, vs, rho:              6587.3          3695.6          2907.7
mantle ave. vp, vs, rho:            8200            4700            3400

              0            3810            1940             920   ice
            764            1500               0            1020   water
           1000            2500            1200            2100   soft sed.
              0            4000            2100            2400   hard sed.
           8000            6000            3400            2700   upper crust
           9000            6600            3700            2900   middle crust
           9000            7200            4000            3100   lower crust
Inspect the Crust2.0 database with cake
We can use pyrocko.cake to access the data and handle the velocity model with cake.
>>> from pyrocko import cake, cake_plot
>>> model = cake.load_model(fn=None, crust2_profile=(23., 59.))
>>> cake_plot.my_model_plot(model)

Global Crustal Database
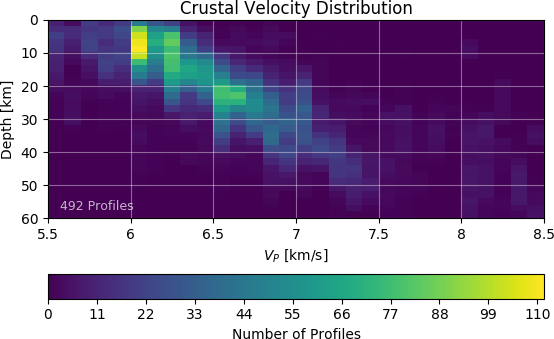
The Global Crustal Database 4 gathers empirical 1D velocity models from seismic reflection and refraction profiles. As of 2013 there are 138939 profiles, mainly P and fewer S wave records in the database.
Citation
- 4
W.D. Mooney, G. Laske and G. Masters, CRUST 5.1: A global crustal model at 5°x5°. J. Geophys. Res., 103, 727-747, 1998.
from pyrocko import crustdb

cdb = crustdb.CrustDB()
europe = cdb.selectLocation(lat=52., lon=20., radius=15.)\
    .selectMinDepth(20)

europe.plot(plot_median=False, plot_mode=False)
europe.plot(plot_median=False, plot_mode=False, vrange=(2000, 6000), phase='s')

Other selection methods are selectPolygon() and
selectRegion().
See dataset for more information on the API.