Report
Grond’s reports are presented in interactive HTML web pages where you can browse and compare different events and inversion runs.

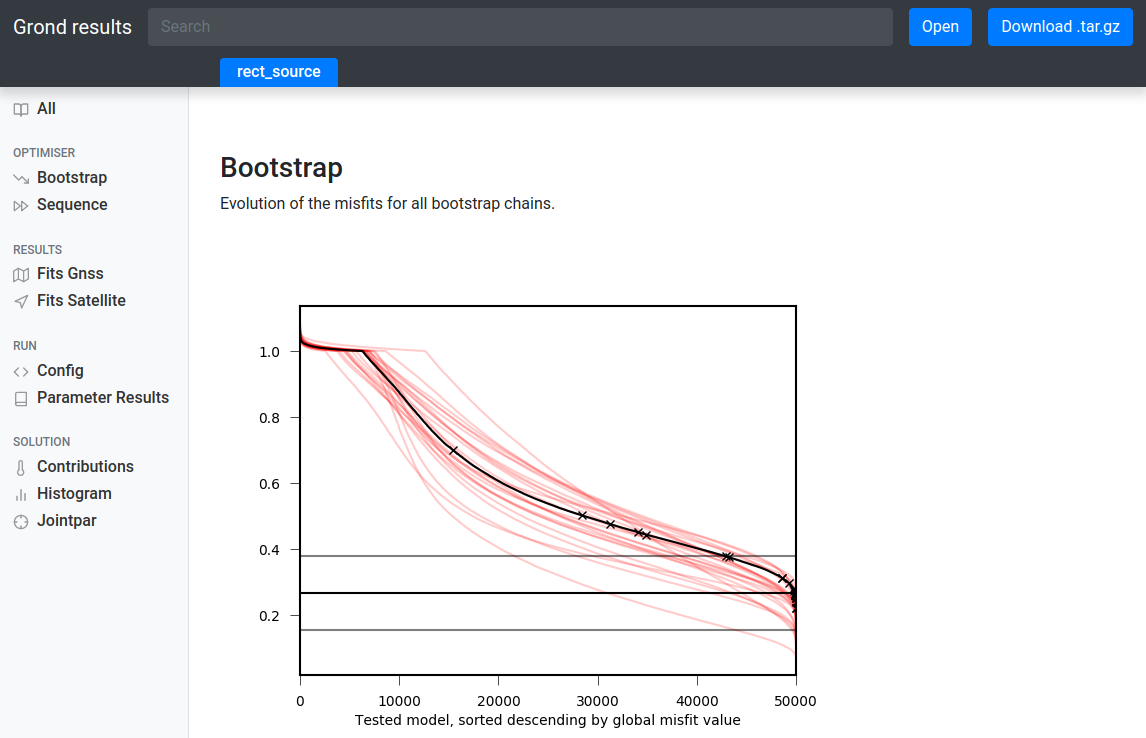
Figure 1: Example of a Grond report, here the bootstrapped misfit evolution of a static inversion is shown. Use the left navigation panel to navigate the plots.
Online example reports
Explore our online example reports to see what information the inversion reveals.
Generating reports
When an inversion is finished, you can create and open a report with:
grond report -so <rundir>
By default, the report is generated in the directory report. Results from
multiple runs are aggregated into a single report directory by repeatedly
calling grond report <rundir>.
The flag -s will serve the HTML pages locally with a built-in web server
and -o will open it in your web browser (see grond report
--help). Alternatively, you can simply open the file report/index.html
with your web browser. If doing so, it may be necessary to adjust browser
permissions to access the report locally (through a file://... URL).
Sharing a report on the local network
When running Grond on a remote machine, run grond report -S to serve the
report directory on the local network. Point the web browser on your
desktop machine to the URL printed on the terminal. If the default server port
cannot be opened, choose a different one using --port=<number> with a port
number in the range 1025 - 65535.
Sharing a report on the internet
The report directory is self-contained and can be transferred to a
different computer for viewing. Place it into a web server directory to share
it with the world.
For convenience, the archive file grond-report.tar.gz contains the
complete report directory. You can find it in the report directory or
under a link on the report web page. After unpacking, place the archive file
into the unpacked directory to keep the archive file link operational.
Available plots
To see which plots are available for a particular configuration, check out the subcommand
grond plot list <rundir>