Report
Grond’s reports are presented in interactive HTML web pages where you can browse and compare different events and inversion runs.

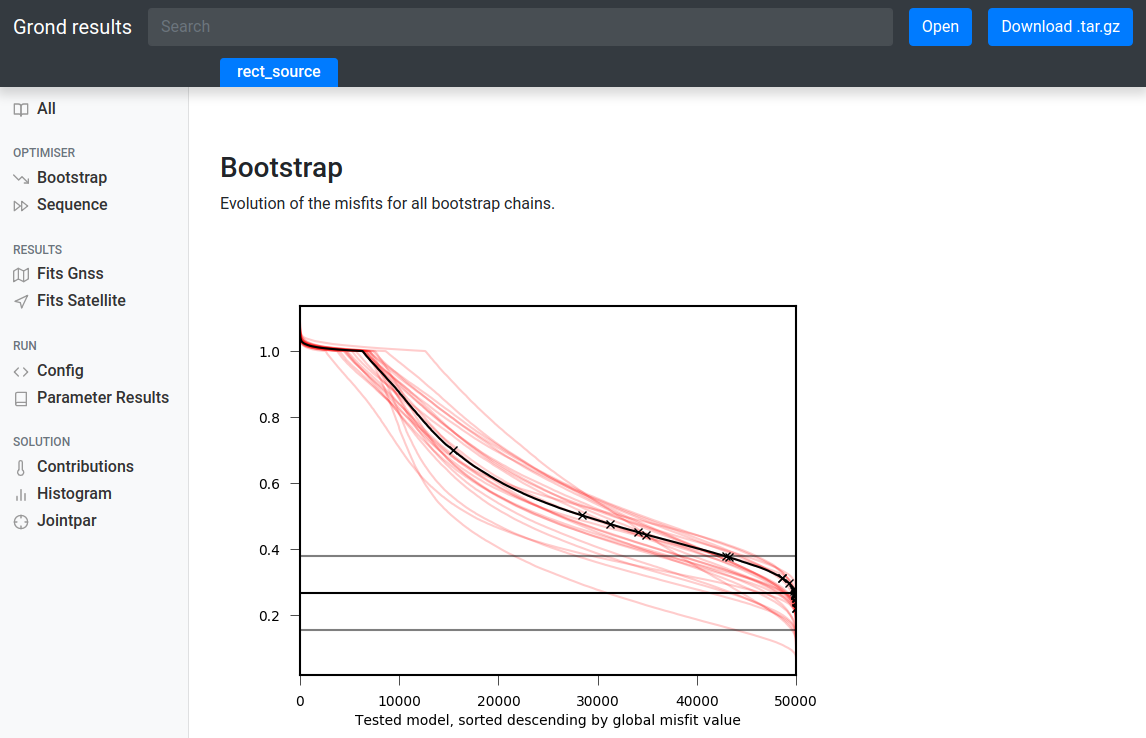
Figure 1: Example of a Grond report, here the bootstrapped misfit evolution of a static inversion is shown. Use the left navigation panel to navigate the plots.
Online example reports
Explore our online example reports to see what information the inversion reveals.
Generating reports
When an inversion is finished, you can create and open a report with:
grond report -so <rundir>
By default, the report is generated in the directory report. Results from
multiple runs are aggregated into a single report directory by repeatedly
calling grond report <rundir>.
The flag -s will serve the HTML pages locally with a built-in web server
and -o will open it in your web browser (see grond report
--help). Alternatively, you can simply open the file report/index.html
with your web browser. If doing so, it may be necessary to adjust browser
permissions to access the report locally (through a file://... URL).
Available plots
To see which plots are available for a particular configuration, check out the subcommand
grond plot list <rundir>